Consumption of weighed components

With this article we will analyze the main production stage for a cosmetics company viz. thebulk production activity. As seen in the previous articles analyzing the previous stages, one or more containers containing all the bags of raw materials weighed by the weighing department and dedicated to the charge to be produced will arrive at our station (e.g. at the turboemulsifier). The operator will have to fill, following the production sheet and the laboratory/industrialization directions (slavishly following the recipe), the machine with the weighed quantities of raw materials, using them in the appropriate way and with the decided timing.

How to ensure the operation ensuring minimum error?

Having a device to guide the operator through this delicate phase is essential and must ensure two key aspects:

  1. The operator must use (consume) the correct components
  2. The operator must perform the steps in the correct order

All this may sound like a triviality, but in a manufacturing environment, with so many components and raw materials present, the perfect execution of these two activities is not such a simple matter. Operators also have to adhere to both an appropriate production grade and to GMP compliance, which consists of a set of principles to ensure production quality. At this point we can ask ourselves: how can all this be done as precisely as possible?

Device features

First, we will have to provide the operator with a light and flexible device that displays at the right time the few pieces of information that are essential to the success of the task and that, in addition to displaying, can allow for quick inputs such as barcode readings printed in weighing. In addition, the display (definitely of the touch type) will have to be able to receive actions even while wearing latex gloves.

The ideal device might be such a wearable or a lightweight, easy-to-use barcode reader such as the Zebra TC21/TC26.

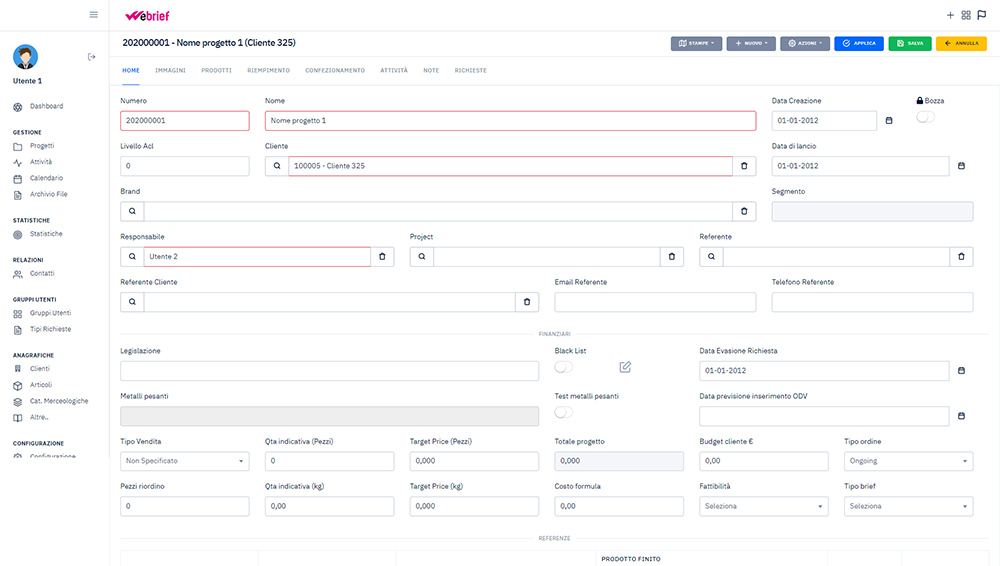
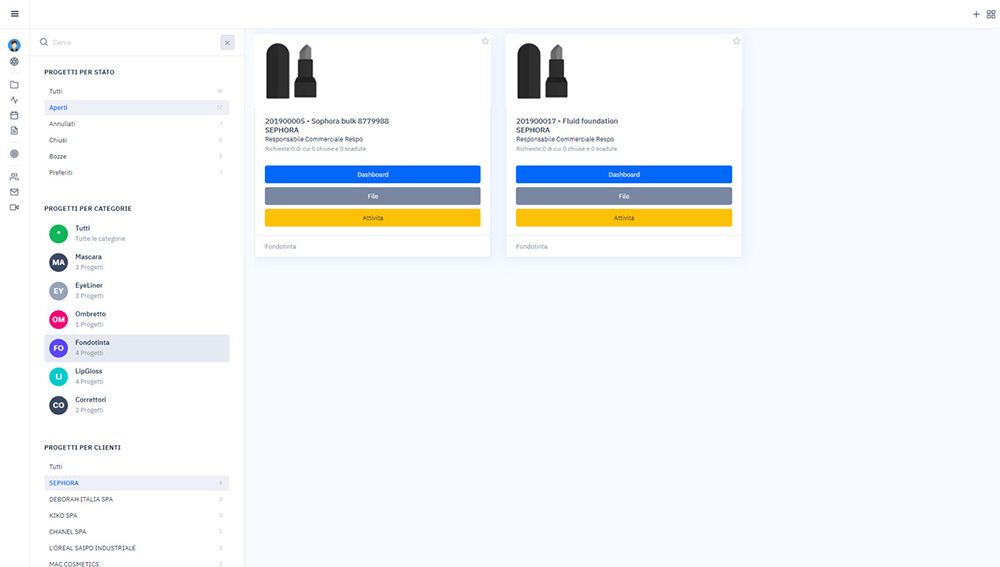
Whether it is one or the other the main screen of the flow could the one shown below.

Guarantee of the correct components

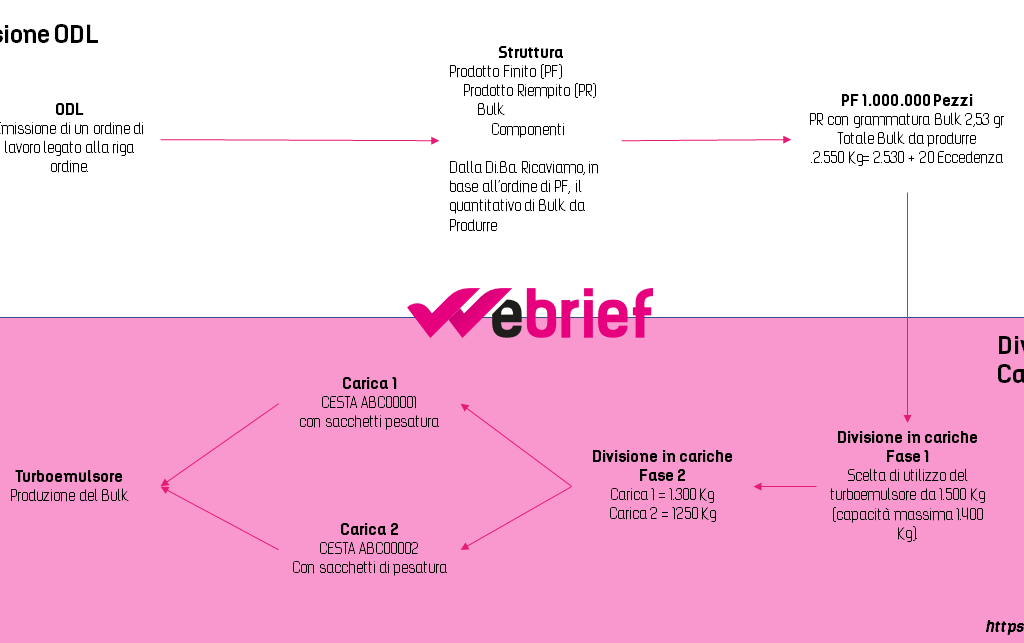
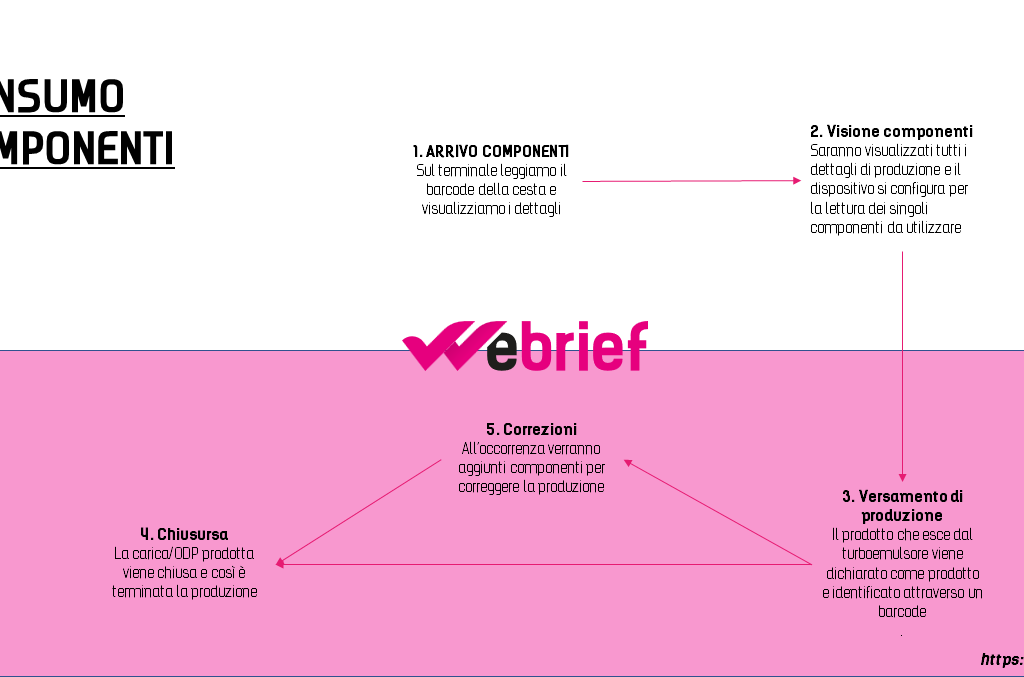
Each component taken from the basket and loaded into the turboemulsifier will have to go through the reading of its barcode (printed and matched in weighing); this step manages to ensure, in real time, the correct picking of the material to be used. The software will have to perform an unloading of the quantity of the component from the "WEIGHTED" warehouse by removing the component from the stock in real time and eventually loading the material into the WIP warehouse of the machine identified for production. In this way, at the computer level, we will have the stocks of raw or semi-finished materials updated in a timely manner; the flow is as you can see in the article cover image.

If the barcode read should not be part of the current processing or, in an extreme case, should be picked up at an inappropriate time, the device should notify the operator of the anomaly and stop any further operation with an appropriate warning.

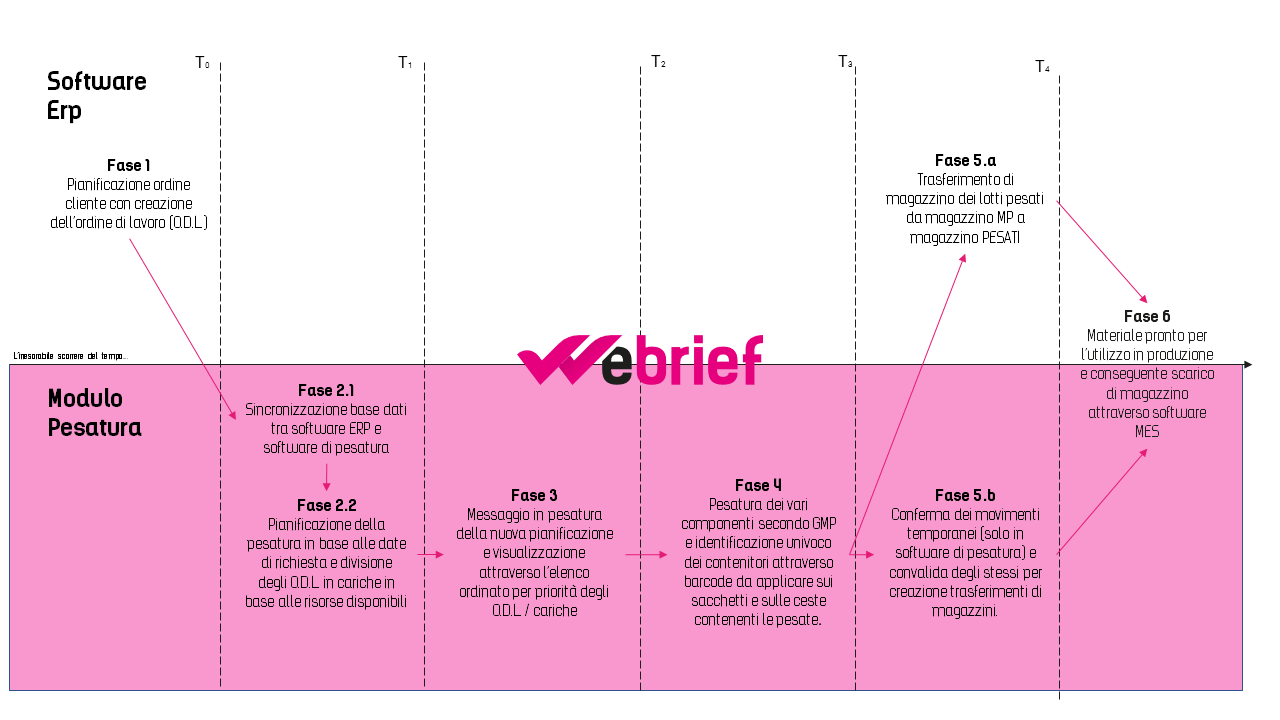
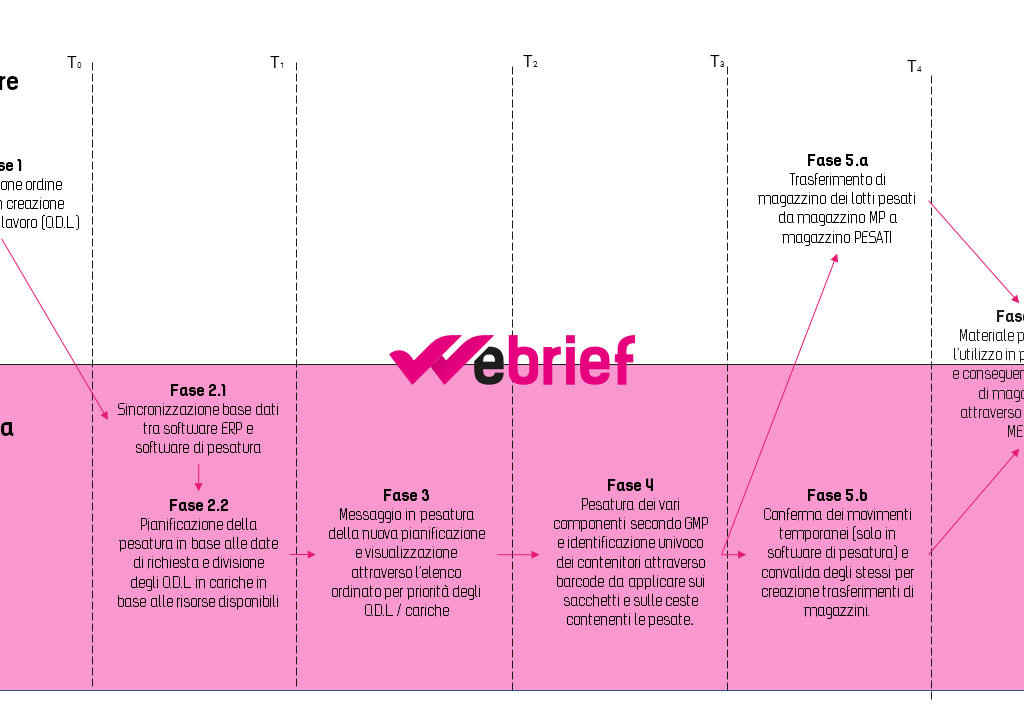
We will analyze the operational flow that must be followed and that the software used must handle properly to ensure the full success of production operations.

Main flow

Step 1: Arrival basket with components

The first operation to be performed is to read the barcode related to the ODP (production order) and the charge matched to the basket brought to the station. If this is not the first ODP to be produced we will have to alert both the operator and the warehouse of the anomaly in order to ensure timely correction action. Reading the ODP will initiate the production open signal to the management system. In this way we could establish the start of operations and display all the production steps stored from the production order.

Step 2: Viewing components divided into stages of use

The device at the workstation should, once the ODP is read, display the first component to be picked up and used in the turboemulsifier. In addition to picking up the component, the various steps to be performed can be displayed so that the development methods created by the research and industrialization departments can be followed perfectly. All of this will also allow one to know at what point in the formula one has arrived and the correct processing times.

Step 3: Production Pouring

With the machine started, the semi-finished product (the bulk) will be "unloaded" into appropriate containers. This operation can be tracked through a special terminal procedure that will allow the following operations to be performed:

  1. WIP stock unloading of used components (optional operation)
  2. Loading the machine output magazine with product (bulk) for the kilograms specified by the operator
  3. Printing of the bulk label with product identification data (and associated barcodes ready for reading at the filling stage)

Step 4: ODP closure and charging

Closing or suspending the ODP will allow the machine operator to capture the closure data and thus track the actual production time. This operation, if not done previously during the production pour, will unload the components from the machine's WIP store and load any bulk product. These load/unload operations will be parameterized on the management side through the appropriate department/machine configuration. The more real time can be maintained, the more checks can be made while maintaining a timely global view.

Step 5: Corrections

Corrections may also be made to the bulk by adding/removing various components. These operations will need to be tracked to understand how much they affect production and how frequently they occur.

Quality Controls

During production, the system will alert the operator of any checks to be performed following the production sheet and production procedures. These will also be imputed directly to the ODP so that, as with corrections, all control activities performed can be traced back.

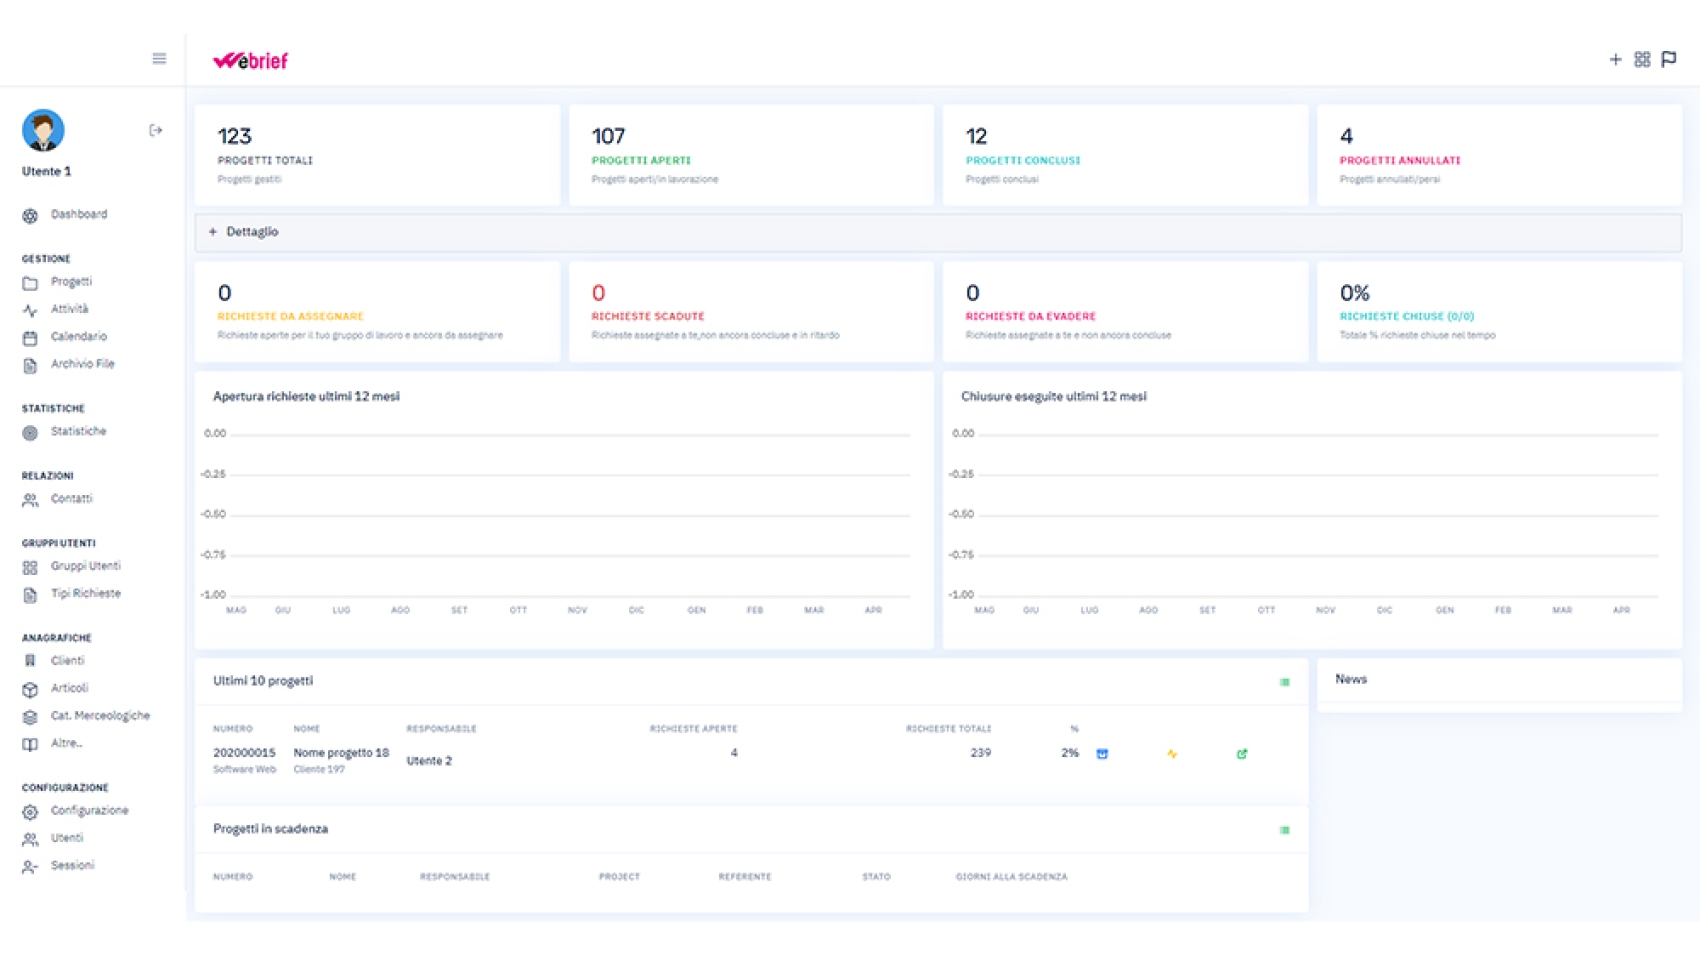
Statistics and production data

Finally, having taken over the production data we could let our imagination run wild and create the statistics that most interest the company. Among the classic ones we could have:

  1. Average processing times divided by texture
  2. Average production times per customer/department/machine
  3. Personnel cost attributable to each ODP
  4. Components handled during production
  5. Components added and modified during the production of an ODP
  6. Number of corrections and quality control for each ODP/department/machine.

There would also be other information related to personnel, machines, maintenance, production time, and more. We will stop here for now and refer you to our website for any additional information.

How to digitalise weighing scales

Networking a digital scale can bring great benefits to your business. How to make this connection depends on the type of device you have. Scales with the ability to be connected to a PC the solutions can, in fact, be of two types:

  1. The scale already has a network (Ethernet) socket and is able to connect directly to the corporate network.
  2. The scale has a serial-type connection.

These two types depend essentially on how "old" the scale is; the connection via serial is the oldest but also the most widely used, and moreover, it is an industry standard that is still maintained on the devices. Unfortunately, today's PCs lack the serial socket so, the only way to collect the signal from these scales will be to convert it and intercept it according to appropriate parameters.

Scales with Ethernet connection

In the case of an Ethernet scale you will simply have to connect the network cable and assign an IP address to the scale (possibly fixed). Having done this you will already be able to talk, with the appropriate software, directly with the scale and intercept data according to the appropriate parameters.

This is certainly the easiest case to handle, and any system-integrator with a minimum of skill will be able to help you with this solution.

Serial connection

We come to the somewhat more complex (and undoubtedly more common) case: your scale does not have an Ethernet output but simply a serial connection.

How to go about digitizing the signal? In this scenario we have several possibilities:

  1. The scale will be connected through the serial cable directly to a physical location (PC) present in weighing.
  2. The scale must be connected to a server: the obligatory step is to convert the serial signal to an Ethernet signal with an appropriate device.
  3. The scale is to be shared among several weighing stations/terminals: again, as in the previous case, we will have to convert the signal with a device.

Direct connection with serial/Usb converter

If the weighing device you are using does not have a serial (RS-232) socket like most of today's PCs, the only viable solution to connect the scale is to equip yourself with an RS-232/USB converter. This will allow you to unify the signals (should you need to digitize multiple scales) and the software will be able to interact directly on the USB that to date has become a "standard" port for these integrations. The cost of these special cables is inside 15 € and it is definitely a reliable solution managed by various software. The main drawback is to create a direct connection between scale and workstation so it is not possible to share the data directly to the company server or other workstations. If you "crash" the workstation, which also contains all the weighing management software, you will need to have technicians come in to restore and connect.

Connection via serial/ethernet converter

In this case we need to equip ourselves with a more complex conversion device than in the previous case. In our experience we have obtained excellent results with converters from MOXA and in particular the NPort 5110 model. To achieve the desired result you will need to connect a serial cable between the scale and the Moxa and a network cable from the Moxa to the company switch; by configuring this appropriately you will achieve weighing sharing within the company network.

The only cons of the solution is that you will have to configure both the sending of data from the scale to the converter and the "remitting" of data from the converter device to the corporate network thus performing a dual configuration. This solution will allow you to share the signal so that you are independent of the device being used and send the data directly to the enterprise server or directly to the cloud.

By doing so, weighing operators will be able to use a variety of devices (whether PCs, notebooks, tablets, etc.), choosing which one is most appropriate for your reality and making you, in effect, untethered in the choice of terminals that will use the data.

Sending signal

There are two types of sending data from the scale to other systems. The two types are:

  1. Continuous sending of the read data
  2. Sending by pressing a key.

You will usually be able to configure continuous sending or sending based on pressing a physical key on the scale via the configuration parameters. The setting procedure is relatively simple and listed in the manuals. If you were unable to retrieve the information, the scale vendor will surely be able to help you.

When to use the two types of sending?

The first method (continuous sending) is very convenient if you intend to automate the weighing with software while the second is convenient if you simply want to send a signal to a device that will allow you to print, for example, a label. This is a technical decision and is related to the "consumer" of the data, so your trusted technician will determine the type of data exchange.

Once the methodology has been established, all you need to do is start the systems and begin to intercept the necessary and required data for digitizing the data. With this data in hand you will surely be able to record various statistics such as:

  1. Average weighing time of individual raw material
  2. Average quantity, by type of matter weighed
  3. Timing of each individual weighing
  4. Timing and weighing divided by operator

Many of these statistics can help you understand which weighing solutions are most effective and how to set up the whole weighing department.

Signal from the scales

Unfortunately, each scale "SENDS" a weighing-related signal according to its own format. That format will certainly be a text-type signal (readable even to a human eye) but in a "proprietary" format. It will be up to your programmers/system integrators to retrieve the data, process it and extrapolate the values thus managing within the company database the weighing. Unfortunately, there is no defined standard in this area and each scale can send data in various ways. This will be the only customization to be implemented on the weighing software.

ODP division into charges and weighing tracking

Introduzione

Una caratteristica peculiare nella produzione di cosmetici è quella di dover dividere la produzione del bulk di un ordine in più cariche. Tale divisione  deve essere fatta poiché la produzione del bulk sulle varie risorse, spesso, non può essere un unico passaggio. Il quantitativo prodotto (inteso come Kg di Bulk) per un’unica lavorazione è limitato alla capacità di ogni singola macchina.

Caso pratico: mascara in turboemulsori

Supponiamo ad esempio che un cliente ordini 1.000.000 di pezzi di mascara con grammatura (grammi di bulk per ogni prodotto) pari a 2,53g (comprensivi di sfrido). Questo calcolo è eseguito tramite la struttura base della Di.Ba. (Distinta Base) del prodotto/formula.

Il bulk totale da produrre per l’ordine è pari a 2.530,00 Kg (2,53 g x 1.000.000 pezzi / 1000 = Kg).
L’azienda dispone di vari turboemulsori per creare il bulk ma quello con capacità maggiore è pari a 1.500 Kg. La capacità sarà nominale e a pieno regime il turboemulsore, con 1 carica, potrà produrre al massimo 1.400 Kg. Come potremmo produrre la cosa? Dividendo i 2530 Kg in due cariche pari a:

  1. carica = 1.400 Kg
  2. carica = 1.150 Kg

Con la seconda carica produrremo 20 Kg in più per eventuali anomalie o quantità da lasciare in campionatura o laboratorio

Tracciabilità

Nel caso sia importante mantenere tracciabilità dal lotto di materia prima pesato sino al singolo bulk prodotto, la procedura di divisione in cariche andrà a scomporre l’ordine di lavoro (ODP) in ODP-Carica1 e ODP-Carica2 (avendo quantitativi di produzione diversi).

Produzione differita

Utilizzando la divisione in cariche potremo anche gestire parte della produzione in anticipo, producendo il prima possibile la prima carica e ritardare la seconda in modo da consegnare parzialmente il bulk al riempimento.

Trovare il mix giusto

Ovviamente ogni azienda, in base alle macchine in proprio possesso, dovrà trovare il mix perfetto per dividere gli ordini in cariche, ottimizzando così i tempi produttivi e le risorse impiegate. Questa scelta, se parametrizzata e gestita con opportuni criteri, potrebbe essere una parte di pianificazione cruciale per il corretto sviluppo aziendale. Con dati alla mano potrebbe essere implementata una procedura automatizzata per la creazione delle cariche in base agli ODP e alle risorse produttive aziendali.

Weighing in cosmetics according to GMP

Over the years we have developed several weighing systems for various clients in the cosmetics field. The problems that need to be addressed are common to all, but the real pitfall is often the result of custom, customer-requested programs that are often found to be botched due to lack of prior analysis or underestimation of issues.
Often, such snags come from both the company and the developer being lacking in experience in this area. The weighing process is a fundamental activity that ensures a production flow according to standards that every cosmetic company is forced to manage judiciously. The inclusion of real-time detection software in this area can either be a competitive advantage (if developed appropriately) or a ballast to contend with on a daily basis.

Why customized programs?

The demand for customized programs as opposed to standard programs, although the result is common (and we will see what you want to achieve next), depends on customers who want to optimize weighing times based on the methodology applied over the years and used by their operators, without upsetting their work habits too much. Like any good IT customization, the weighing module, too, must adapt to the user without distorting its nature. Standard software will still need to be customized, and optimization work will still be necessary.

Common flow

As mentioned earlier, the flow-that is, the problems and how to solve them-is really common and is summarized in the diagram opposite.

The flow is divided into timeframes (highlighted by the vertical blocks) and the two horizontal bars representing the application scope (ERP Software and Weighing Module) and shows the actions performed for proper information management.

Stage 1

Like any production, the initial startup is triggered when a product order line is entered. The order can be of various types:

  1. Finished product orders from customer
  2. Bulk order from customer
  3. Internal order order for warehouse re-integration

In each case this will have to say what we need to produce, how much we need to produce, and possibly the date by which to produce.

Stage 2

This activity is divided into two parts: the first, fully automatic while the second is semi-automatic.

Step 2.1

The weighing module, by reading and synchronizing order rows with the company ERP (integration can be done in multiple modes), will transpose changes and new productions with all necessary data.

This whole phase is an automatic procedure that can be launched independently by the system by running it at predefined time intervals.

Step 2.2

Based on the synchronization we will have to plan the production dividing the work order into its processing charges. This is a special feature of the industry that we will address in a later post. The choice may be of two types:

  1. Fully manual: the operator will choose how and how much to divide
  2. Semi-automatic: the system will propose values based on configuration parameters

The result of phase 2 will be to generate a weighing plan for the various locations by dividing, through the structure of the configured BOMs, the components to be weighed. The components may be either raw materials or semi-finished products.

The phase may be performed several times in the day according to business needs.

Stage 3

Upon confirmation of step 2, the weighing module will alert the manager who will view the weighing plan (the ODLs divided into charges) according to the priority criterion established by the company. This control station may be directly a terminal in weighing or a dedicated page on the manager's station. Always consider extrapolating the lists that a software provides in excel format because it is very convenient to process out of the system or to use as paper summaries.

Stage 4

The weighing station could have several hardware features. First, it could be a touch-screen station with a barcode reader; alternatively, it could be a handheld device with an integrated barcode reader. Of these devices there are many brands. Among the most popular are Motorola, Denso, and Zebra. Optionally, but highly recommended, integration of the signal from the scales so that the measured data (the weight) is directly handled by the system and not manually imputed by the operator. Integration of scales can be done in various ways, which we will see in a future article.

What should a weighing module display?

The information to be displayed is multiple and will require the use of multiple masks. The minimum list to be requested is as follows:

  1. ODL list to be weighed: this mask is useful if a completely paperless system is desired. As an alternative to this one could use a barcode on the ODL and, upon reading this, take the operator to the next mask.
  2. Component list: the second mask, once ODL/load to be weighed has been chosen, will display all components (in table format) with the quantities to be weighed and weighed. In this mask we will choose the component (via touchscreen or barcode) and the system will prepare for weighing.
  3. Available lot list: having to manage component lots it will be useful, once the material to be weighed has been chosen, to have a list of lots (sorted by FIFO, LIFO, FEFO, etc.) with possible locations. In this way, only valid lots will be accepted giving feedback to the operator if they make a mistake in picking (via barcode reading)

Tips for the graphical user interface

Always remember to keep the masks simple with very large, easy-to-read fonts (this is not a program used in the office but in production). Information should be visually punchy (pictures, colors, etc.) and any error signals should attract the operator's attention.

Label and weighted uniqueness

With each weighing, the system will have to print unique labels containing important information for material traceability and to ensure weighing uniqueness. Each weighing will have to be managed in the weighing module database by attaching automatic information such as:

  1. ODL and charge
  2. Weighing code (usually an autogenerated sequence number)
  3. Part number
  4. Component lot
  5. Quantity required
  6. Weighed quantity
  7. Weighing operator
  8. Date/time/minutes and seconds of weighing

These 8 data constitute the unique identification of the weighing within the entire weighing system.

Container baskets

We have always recommended that the first time an ODL/load is weighed, a label containing the basic data of the ODL to which it belongs should be printed. Such a label will thus create a virtual warehouse of the various weighed components so as to group them together and not scatter bags mistakenly to other productions. To do this you will have to allocate adequate space for both weighing and production so that the baskets can be conveniently and safely transferred. Label reading by terminal will allow the operator to know the contents of the basket at all times.

Step 5

Step 5 may change according to the needs and features of the enterprise ERP software. The simplest case is to create a stock movement (stock transfer) at each weighing for the quantity/component/batch. You will automate this transfer from the RAW MATERIALS/STOCK warehouse to the WEIGHTS WAREHOUSE.

Alternatively, instead of creating each movement at the same time as each weighing, you can create a mask within the weighing module that will list all the weighings executed and not yet "moved" in the ERP and manually launch the execution of the movement. The two solutions are still valid but have pros and cons, respectively. One tip is to have a weighing module that allows you to choose the two modes of action via configuration parameters so that you can decide at any time whether to use the automatic type or not.

Automatic transfers vs. manual transfers

Automatic transfers

  • Pro 1: stock updated in real time
  • Pro 2: Queries for lot availability are easy because everything is in real time
  • Cons 1: If the operator makes a mistake in weighing you must have a routine available that reverses the stock transfer. Usually this procedure is very complex

Manual transfers

  • Pro 1: Any weighing can be checked and possibly changed by hand
  • Cons 1: More complex batch inventory queries (must account for products weighed and not yet transferred)
  • Cons 2: Need for an operator to act as a super-vision.

Both choices are valid, so it is just a matter of being able to field test what is best for your company. That is why we recommend a system that has both choices and gives you wide margins for parameterization.

Step 6

The last phase under consideration is not so much about the weighing module but more about starting the second production phase proper. Basically, with the components weighed and identified in their own bags/baskets, we have the ability (only if we go through weighing software first) to be able to directly download through the use of barcodes the components during bulk production.

This flow is not analyzed in this post but we will describe it in a later one.

Conclusions

The weighing module is one of the essential modules for digitizing your business. Using it ensures:

  1. Effectiveness
  2. Accuracy
  3. Creating data for future analysis
  4. Traceability and traceability
  5. Error correction and real-time reporting

The module is part of a series of available software that ensures fast and fully digitized operational flows. If you are interested in learning more about all the software download from the following link our operating manual dedicated to the cosmetics industry for building a complete and functional information system. In the document we will analyze all the necessary and essential software for a cosmetic company and how to integrate them with each other.

If you would like to schedule an appointment with one of our technicians, contact us by pressing this LINK. We can talk in person about all the problems we have faced and solved in our years of working with companies in the cosmetics industry. A digitized company is an efficient and competitive company and is the only way to win in today's market.

Creating-a-new-project

Creating a new project

Ben trovati; dopo aver visto come ricercare un progetto (in questo link trovate l’articolo pubblicato precedentemente) passiamo ora ad analizzare gli elementi principali che compongono un progetto all’interno del weBRIEF. Per una descrizione generale potete far riferimento al seguente link (Progetto). Se volete approfondire la conoscenza sugli elementi del progetto continuate pure la lettura; analizzerò i singoli punti e come interagiscono all’interno del software creando flussi informativi automatici e parametrizzabili.

Alla creazione di un nuovo progetto la maschera visualizzata è la seguente:


NUOVO PROGETTO

Il numero viene creato in automatico ed è un progressivo che si azzera ogni anno. La descrizione, campo obbligatorio, è come voglete “titolare” il progetto e sarà uno dei campi di ricerca principali. Gli altri dati di anagrafica sono i seguenti:

  • Livello ACL (default 0 max 99)
    è il livello che l’utente deve avere (nella scheda utente di configurazione) dal quale vedere il progetto.
  • Bozza
    se il progetto è in bozza non verrà visualizzato da nessuno al di fuori degli autorizzati. Questo è per tenere progetti in uno stato temporaneo così che nessuno possa creare azioni sino al rilascio dello stesso (magari per un progetto non abbiamo tutte le informazioni necessarie).
  • Data creazione
    campo non editabile e contiene la data di creazione del progetto.
  • Data di lancio
    data previsto lancio del progetto (per una eventuale statistica).
  • Responsabile
    utente che crea il progetto e che verrà sempre avvisato di eventuali modifiche e azioni accadute sul progetto.
  • Project
    altro utente che verrà ragguagliato di tutte le azioni sul progetto ma che non è il diretto responsabile.
  • Referente cliente, email, telefono
    dati del referente del cliente. Tali dati sono auto-salvati creando così uno storico di tutti i riferimenti per i vari clienti.

Dopo i primi dati anagrafici andrete a compilare i dati finanziari (dati del tutto facoltativi) che sono:

  • Fascia di mercato
    da tabella pre-configurata; 1 valore selezionabile.
  • Legislazione
    da tabella pre-configurata, possibilità di scegliere N valori.
  • Data evasione richiesta
    data per la quale sarà necessario assolvere a tutte le richieste.
  • Tipo vendita
    da tabella pre-configurata; 1 valore selezionabile.
  • Qta indicativa (Pezzi)
    come da descrizione.
  • Target Price (Pezzi)
    come da descrizione.
  • Budget cliente
    come da descrizione.
  • Tipo ordine
    come da descrizione.

Successivamente ci sono campi fondamentali che identificano il prodotto e il progetto:

  • Categoria
    da tabella pre-configurata; 1 valore selezionabile.
  • Famiglia
    da tabella pre-configurata; 1 valore selezionabile.
  • Linea
    da tabella pre-configurata; 1 valore selezionabile.
  • Riferimento prodotto
    eventuale prodotto precedentemente creato su cui basare le specifiche tecniche.
  • Stato (Attivo/Concluso/Annullato)
  • Contrattazione (In contrattazione/Acquisito/Dormiente(Rifiutato)

Nella prima configurazione del progetto avremo anche la possibilità di specificare una immagine legata al prodotto (come si dice “un’immagine è meglio di mille parole”). Inserito il progetto attraverso il bottone APPLICA (o SALVA) verrà avvisato l’utente project (se presente) del nuovo progetto creato e gli operatori potranno iniziare a lavorare sulla nuova lavorazione (ovviamente se non in stato bozza).

Questi sono i dati principali che costituiscono il progetto. Nel prossimo articolo analizzeremo i dati aggiuntivi specifici per il settore. Come sempre siamo a vostra disposizione sia per chiarimenti sia per suggerimenti attraverso il bottone che trovate qui sotto.

Compila i dati e rimani connesso e aggiornato!

List-projects

Project List

Bentornati, continuiamo l’analisi dei contenuti del nostro software attraverso l’analisi di una pagina principale ovvero l’elenco dei progetti. Se avete perso l’articolo precedente ovvero l’analisi della nostra DASHBOARD vi rimandiamo a questo link.

I progetti sono il cuore pulsante di tutto il software. Ogni progetto è un contenitore virtuale che racchiude tutti gli scambi di informazioni che avvengono costantemente tutti i giorni all’interno della vostra azienda e con i vostri clienti. La struttura di un progetto è complessa e può variare in base alla personalizzazione richiesta.

La ricerca dell’elenco è effettuabile attraverso azioni eseguibili in questa unica pagina che visualizzerete attraverso il menu PROGETTI del menù laterale.
La visualizzazione è suddivisa in 2 fasce verticali ben distinte:

  • Fascia sinistra
    contiene i campi di ricerca più importanti
  • Fascia centrale/principale
    contiene i risultati ovvero l’elenco di tutti i progetti in base ai criteri di ricerca utilizzati

I criteri di ricerca sono i seguenti:

  • Ricerca descrittiva
    se conoscete il nome del cliente, la descrizione del progetto o il numero lo potete inserire nella casella apposita per ottenere i risultati voluti. Tale ricerca lavora su questi 3 campi e analizza tutto il database per ottenere i risultati migliori.
  • Progetti per stato
    questo criterio è sempre applicati e viene visualizzato il selezionato attraverso una fascia grigia di selezione. La sua valorizzazione è sempre applicata alla ricerca e permette di filtrare sempre i risultati in base al loro stato. La ricerca di default (quella proposta in automaticao dal sistema) è sempre relativa allo stato APERTI.
  • Progetti per categorie
    Elenco di tutte le categorie che gestiamo all’interno del software.
  • Progetti per clienti
    Visualizzazione di tutti i progetti divisi per clienti.

Ogni valore è direttamente selezionabile per ottenere una ricerca più puntuale. Ad esempio vediamo una fase di selezione:

Fase 0: Tutti i progetti aperti

Fase 1: Progetti aperti di tipo FONDOTINTA

Fase 2: Progetti aperti di tipo FONDOTINTA del cliente SEPHORA.

Questa visualizzazione è nata per potervi semplificare la ricerca in base a filtri incrementali di facile applicazione.

Risultati: i risultati ottenuti saranno blocchi contente informazioni principali quali:

  • Numero e descrizione progetto
  • Cliente
  • Nome del responsabile aziendale
  • Numero richieste totali e chiuse
  • Categoria prodotto

Da questo blocco potrete aprire le tre maschere di gestioen principale che sono:

  • Dashboard
    per visionare tutto lo stato del progetto.
  • File
    elenco di tutti i file passati dal progetto.
  • Attività
    elenco di attività che dovrete eseguire sul progetto.

Questo è solo una piccola introduzione all’utilizzo di questa funzionalità base del weBRIEF; siamo sempre ricettivi qualora aveste suggerimenti o richieste che servano a migliorare il vostro lavoro e il nostro prodotto. Per qualsiasi contatto e informazione non esitate a contattarci attraverso il bottone che trovate qui sotto.

Compila i dati per restare sempre aggiornato!

dashboard

Dashboard


Benvenuti nel primo di una serie di articoli dedicati all’utilizzo del weBRIEF. Ovviamente tutte le nostre considerazioni vanno adeguate alla vostra realtà. Non abbiamo nessuna sfera magica che possa risolvere tutti i problemi; il nostro scopo è semplicemente quello di portarvi alla luce casi pratici o esempi applicativi applicati al nostro software e che speriamo vi aiutino a ragionare circa eventuali problemi emersi nel vostro lavoro.

  • Barra superioriore
  • Barra di navigazione laterale (quella a destra contente i menù)
  • Parte centrale: elenco principale contenente i dati delle differenti pagine

Barra superiore

Nella barra superiore noterete una o più icone (in base al tipo di accesso che avete): la prima è un bottone con il simbolo + che vi permetterà, qualora foste autorizzati, di creare un nuovo progetto.

NUOVO PROGETTO

La seconda icona vi porterà, da qualsiasi punto voi siate, alla vostra dashboard.

TORNA ALLA DASHBOARD

Questo è il cassico menù dove ogni utente potrà navigare all’interno di tutto il prodotto e, premendo l’immagine sopra il vostro nome, potrete personalizzare tutti i parametri legato al vostro utente.

Dashboard

Veniamo dunque alla pagina principale. In questa visualizzazione potete leggere tutti i macro-dati riguardanti il vostro utente. Dali dati sono i seguenti:

Fascia 1: Progetti

  • PROGETTI TOTALI
    numero progetti gestiti all’interno di tutto il software.
  • PROGETTI APERTI
    numero progetti in stato aperto.
  • PROGETTI CONCLUSI
    numero progetti in stato chiuso.
  • PROGETTI ANNULLATI
    numero progetti in stato annullato (perchè persi o annullati).

Tutti questi blocchi sono direttamente selezionabili e vi indirizzeranno all’elenco progetti (con selezione attiva in base a quello scelto).

Fascia 2: Richieste

  • RICHIESTE DA ASSEGNARE
    se siete responsabile vedrete tutte quelle da assegnare.
  • RICHIESTE SCADUTE
    tutte le richieste in vostro carico non ancora chiuse e scadute (in base a parametri che vedremo in un prossimo articolo).
  • RICHIESTE DA EVADERE
    tutte le richieste non chiuse ma ancora non scadute.
  • RICHIESTE CHIUSE
    percentuale e numero di richieste chiuse da voi.

Anche questi blocchi sono selezionabili e vi indirizzeranno nella visualizzazione delle attività.

Fascia 3: Grafici richieste

In questa parte di monitor visualizzerete, per i 12 mesi precedenti ad oggi, due tipologie di informazioni:

  • Aperture
    numero di richieste, divise per mese, che un vostro collega vi ha aperto o che il vostro responsabile vi ha assegnato.
  • Chiusure
    numero di richieste che avete chiuso, divise per mese.

Fascia 4: Ultimi 10 progetti

In questa fascia vedrete tutt gli ultimi progetti ordinati per data di creazione decrescente ai quali avete contribuito o che per i quali è richiesto il vostro contributo. Da questo elenco visualizzerete:

  • Dati di base come codice e descrizione progetto
  • Il responsabile del progetto (persona all’interno dell’azienda che ha la responsabilità della gestione del progetto)
  • Numero di richieste aperte e totali con la percentual
  • I bottoni dedicati all’apertura dell’anagrafica, della dashboard e dei file del progetto.

Questa visualizzazione, altamente personalizzabile, è calcolata in tempo reale in base alle attività eseguite da tutti gli utenti per tutti i progetti. Racchiude macro-informazioni che servono al singolo operatore per capire come sta procedendo l’attività lavorativa.

Ci vediamo presto con un altro articolo; se nel frattempo volete più informazioni contattateci premendo il bottone sotto, siamo a vostra completa disposizione.

Compila i dati per restare sempre aggiornato!