Effective Communication
One of the main problems of remote work is communication. Without face-to-face interaction, information can easily get lost or misinterpreted. Online communication tools such as Slack, Microsoft Teams, and Zoom offer powerful solutions to keep the team connected.
Slack and Microsoft Teams are instant messaging platforms that allow you to create specific channels for different projects or departments. These tools also support file sharing and integrations with other applications, making communication smooth and centralized.
Zoom, on the other hand, has become synonymous with video conferencing. With its high-quality video and audio capabilities, Zoom facilitates efficient and productive virtual meetings by reducing the distance between team members.
A comprehensive solution would be to integrate all of these capabilities, allowing the creation of project chats, virtual meetings and organized discussions, all within the same platform i.e., through a PLM. This centralized approach eliminates the need to switch between applications, saving time and reducing the risk of losing important information.

Project Management
Remote project management requires tools to efficiently plan, track, and coordinate activities. Platforms such as Trello, Asana and Monday.com are popular in this area, but specific PLM offers some unique features that deserve attention.
Trello uses a Kanban whiteboard metaphor, with cards and lists to organize tasks. It is simple and visually intuitive, ideal for small- to medium-sized projects. Asana and Monday.com offer greater complexity, with advanced features for resource management, prioritization, and progress tracking.
A PLM software combines the best aspects of these tools, offering highly customizable project management; in fact, you can create project-specific workflows, assign tasks to team members, set deadlines and monitor progress in real time.

Sharing and Collaboration on Documents
Another common problem in remote work is document management and sharing. Tools such as Google Drive, Dropbox and OneDrive are essential to ensure that all team members have access to the information they need.
Google Drive and Dropbox offer cloud storage solutions that enable easy and secure file sharing. OneDrive, part of the Microsoft suite, integrates seamlessly with other tools such as Microsoft Office, facilitating collaboration on documents.
A PLM goes further by providing a platform where documents can be not only shared but also collaborated on in real time. With its collaborative editing capabilities, team members can work on the same documents simultaneously, see changes in real time and leave comments. This significantly reduces review and approval time, improving overall efficiency.

Monitoring and Reporting
Monitoring project progress and generating reports is crucial to maintaining control and making informed decisions. Tools such as Jira, Basecamp, and ClickUp are often used for these functions, but a PLM offers an integrated approach that simplifies the process.
Jira is popular among software development teams for bug tracking and Agile project management. Basecamp and ClickUp offer project monitoring features that include calendars, to-do lists, and communication tools.
PLM integrates monitoring and reporting capabilities, allowing managers to see project status in real time, identify any issues and generate detailed reports with one click. This level of visibility helps keep projects on time and on budget while ensuring quality of work.

Security and Privacy
Data security is a growing concern, especially when working remotely. Tools such as LastPass, Bitwarden and security solutions built into collaboration software are critical to protecting sensitive information.
LastPass and Bitwarden are password managers that help keep login credentials secure. Security solutions built into tools such as Google Workspace and Microsoft 365 offer additional protections for corporate data.
Using software that takes security very seriously, implementing end-to-end encryption, two-factor authentication and stringent access controls is critical to safeguarding such valuable corporate data. These measures ensure that only authorized individuals can access sensitive information, reducing the risk of data breaches.
Conclusion
Remote work presents unique challenges, but with the right online collaboration tools, these challenges can be overcome. Use a comprehensive project management solution, combining communication, project management, document sharing, tracking and security features in one platform.
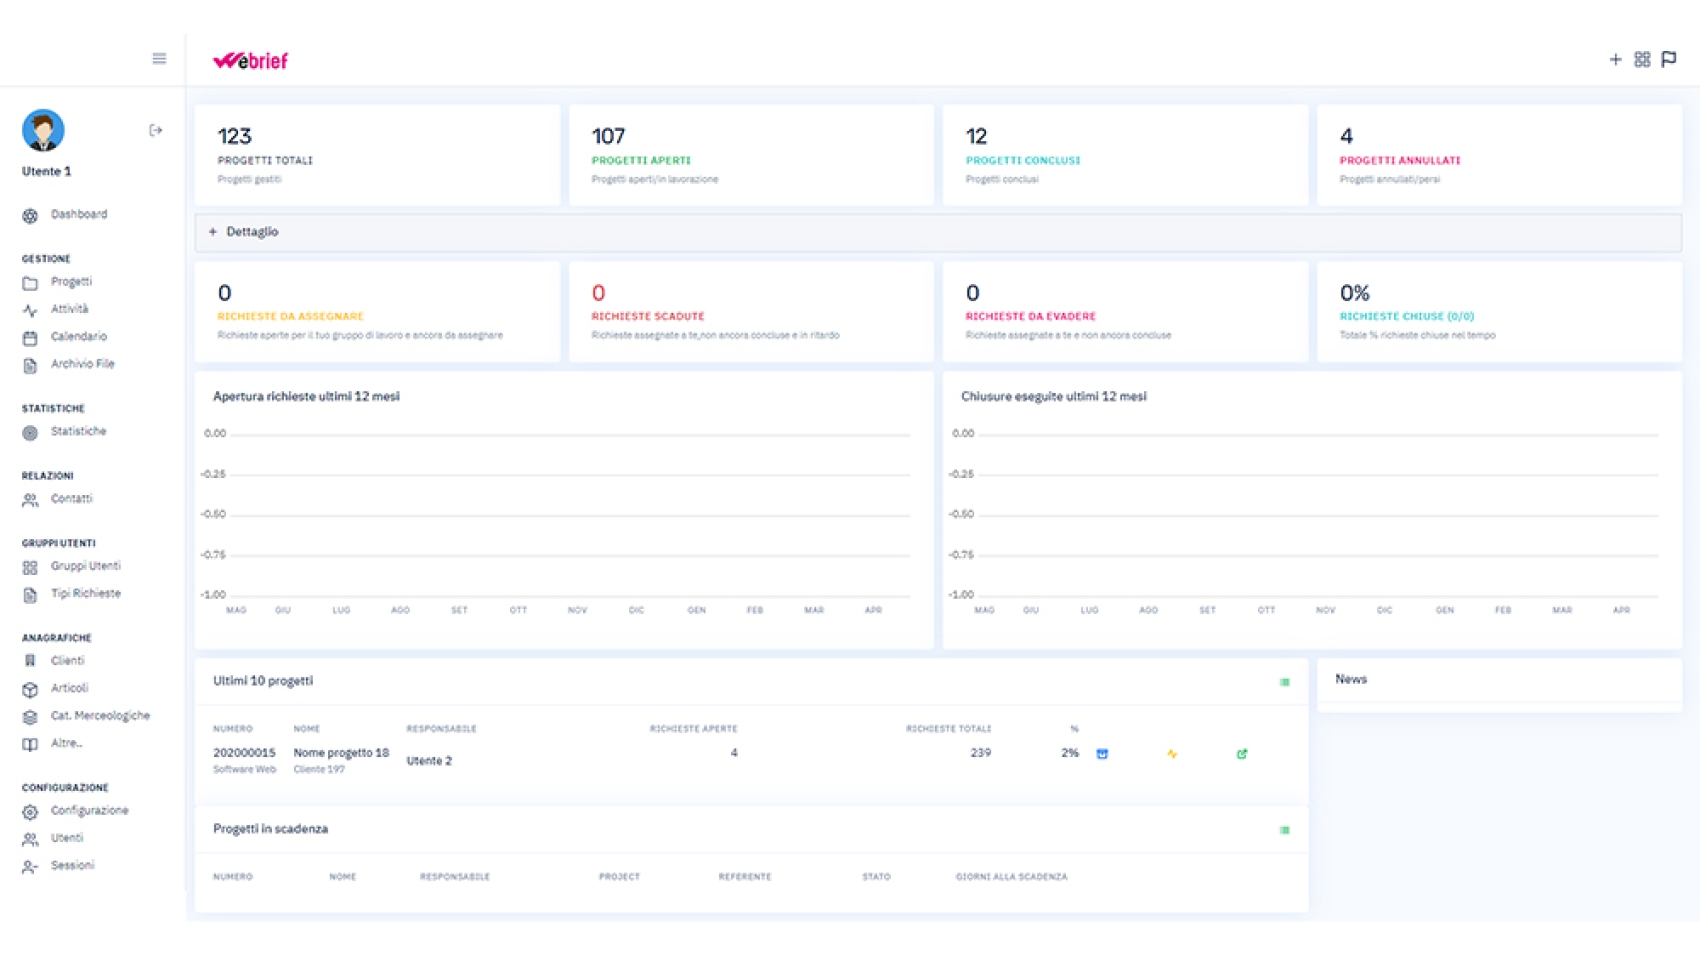
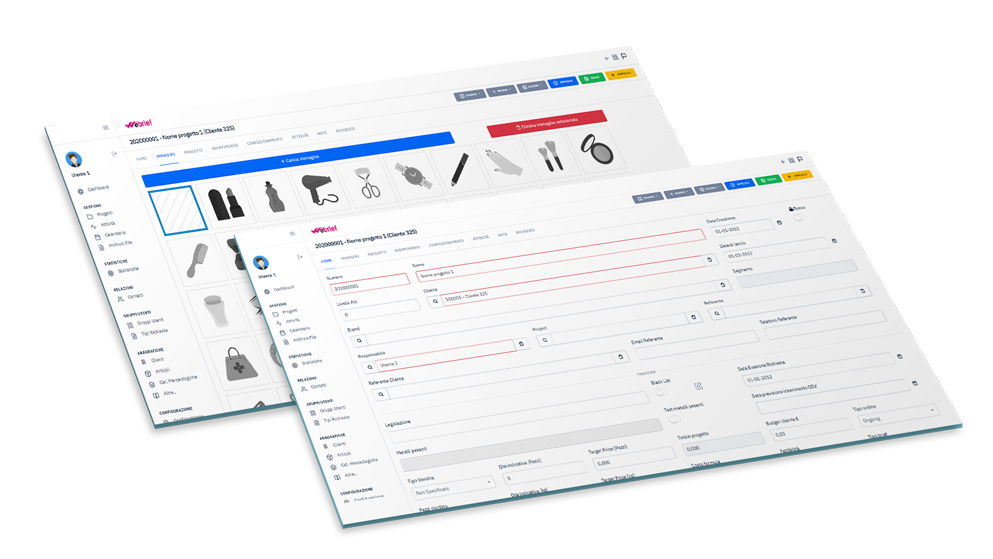
Now that you know what you need to implement but don't know where to start, don't worry. We have already developed the ideal PLM for cosmetic companies and it is called weBRIEF.
What benefits
will you get?
How we work
- 1 - Requirements analysis and software installation
- 2 - Interface with enterprise software and customization
- 3 - Starting and finishing
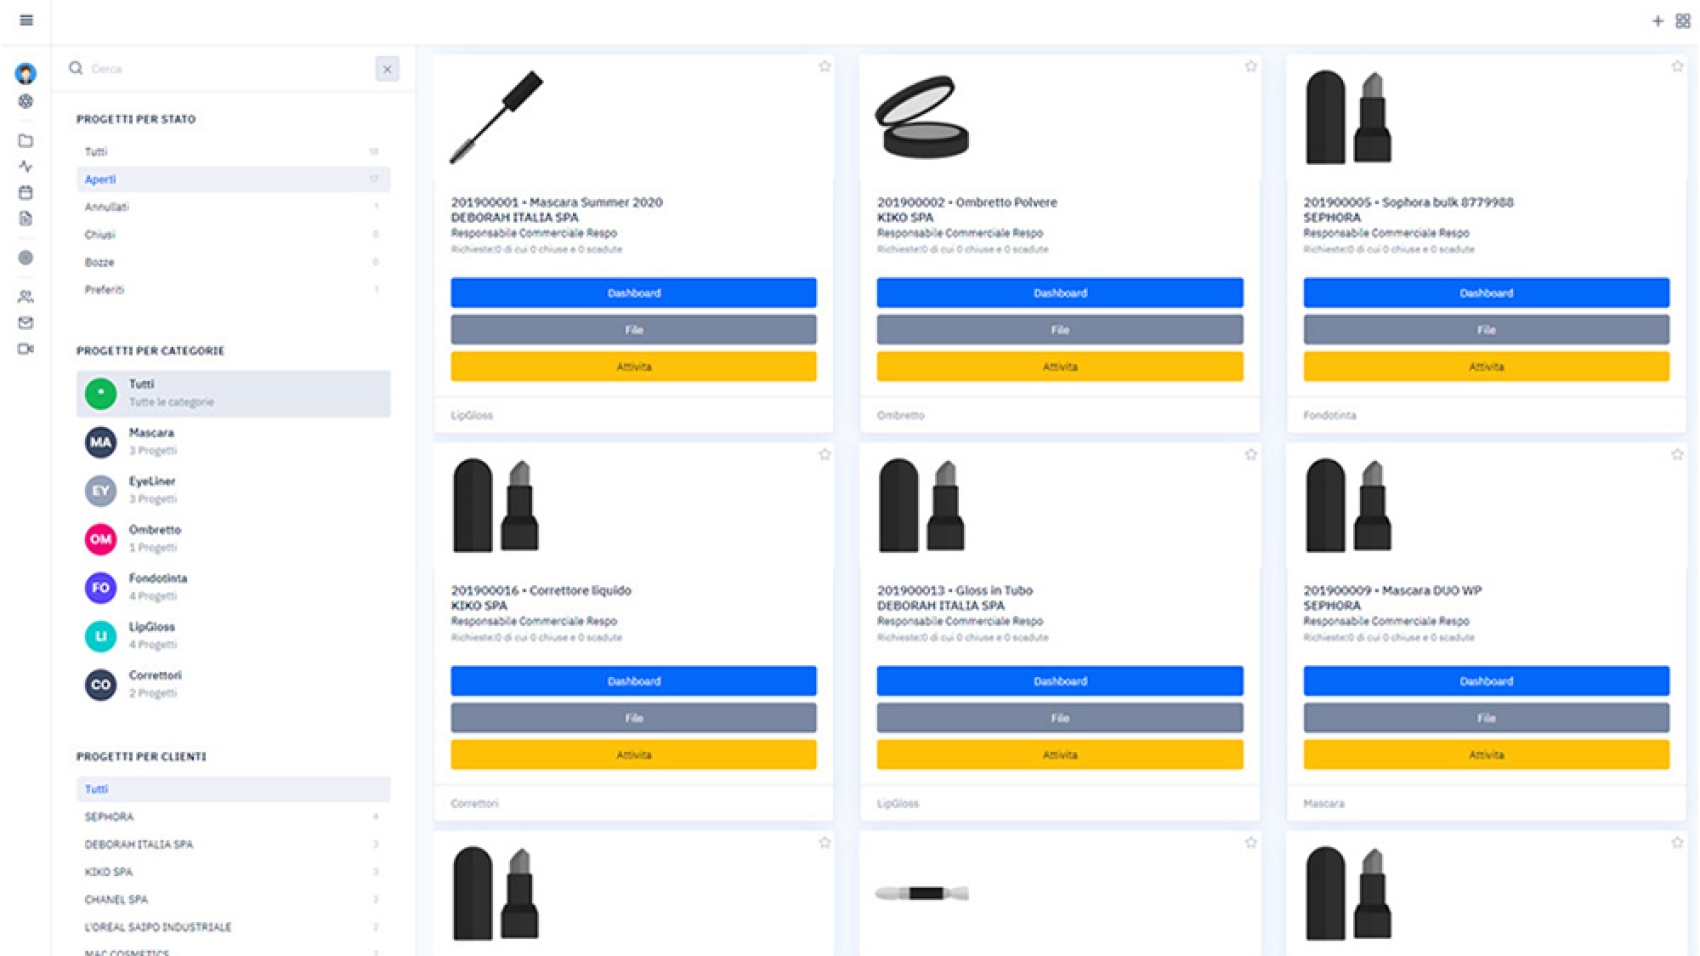
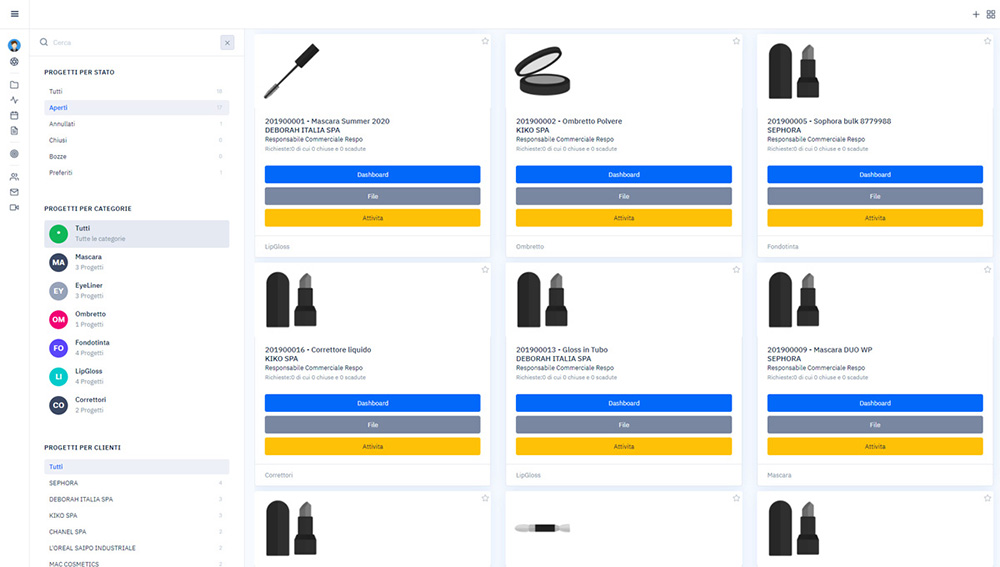
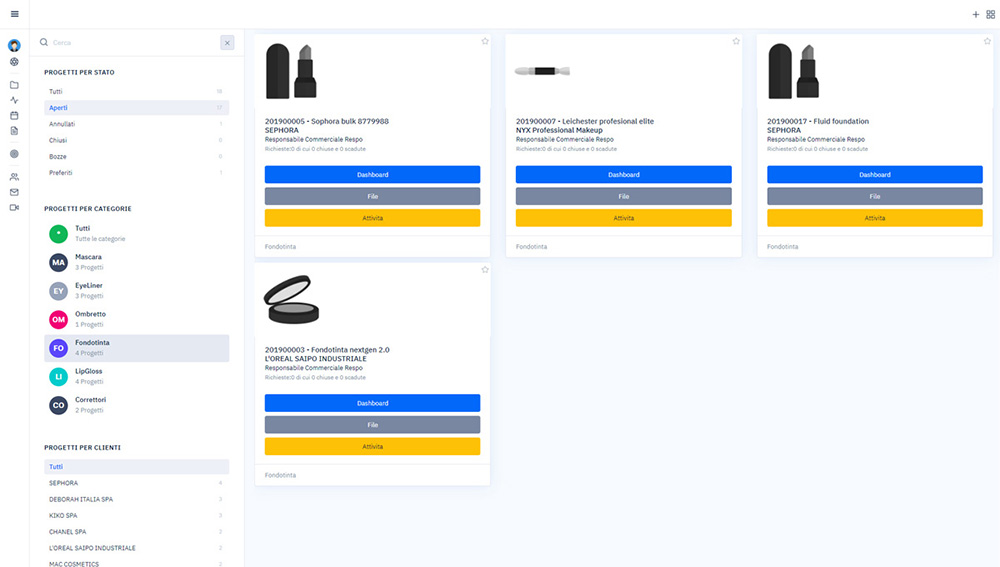
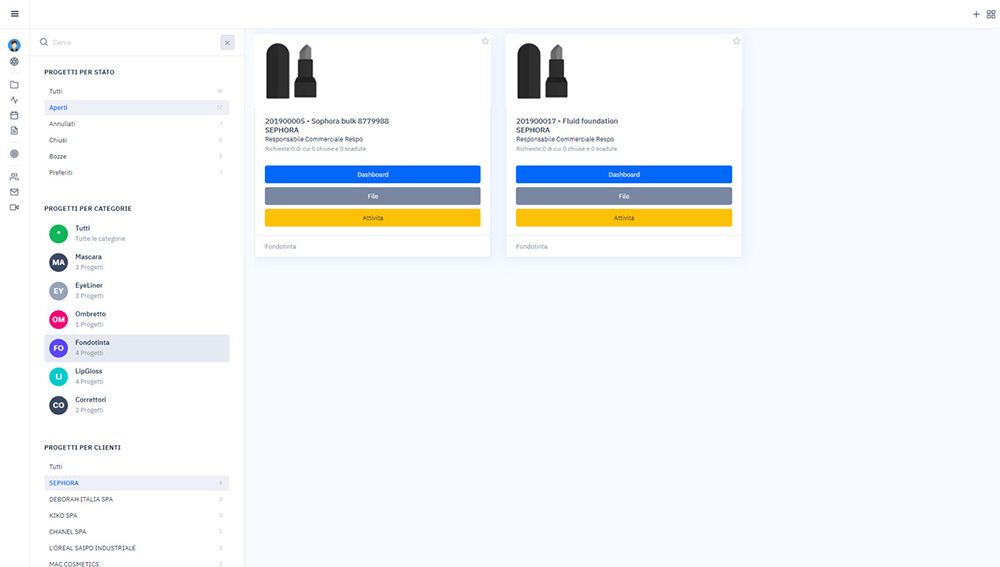
- #1 Centralized archive
- #2 Project activities and gantt
- #3 Statistics and exports